

TDSD - The Audit
Welcome to the weeds. On this page, we are diving deep into the underlying math, the formulas used, and the precise data-entry anomalies found within the statistical models of the 2006 guppy sex ratio study. Here is a breakdown of how the math should look, where the authors unintentionally deviated from their own guidelines, and the specific mistakes uncovered while I was attempting to reproduce their data.
The Statistical Rulebook
In their methods section, the authors established a clear mathematical hierarchy for analyzing whether a skewed sex ratio was truly statistically significant, based on the sample size of each individual brood (N per sex):
- Large Broods (N > 25): Standard Chi-squared (χ²) Goodness-of-Fit test.
- Medium Broods (5 ≤ N ≤ 25): Yates-corrected Chi-squared test (to prevent overestimating significance in small sample sizes).
- Small Broods (N < 5): Fisher’s Exact Test.
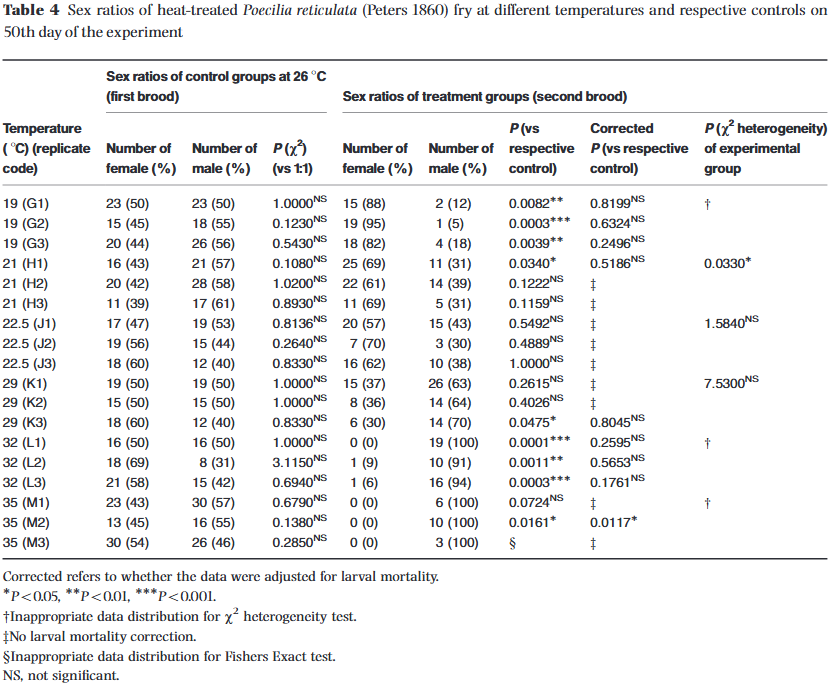
On this page, I will focus primarily on the values within the column labeled P(χ²) (vs 1:1) in Table 4 (reproduced below). While I performed these exact same quality checks across the entire dataset, this specific column was the culprit behind the values I had a hard time replicating—or found completely unreproducible despite my best efforts.
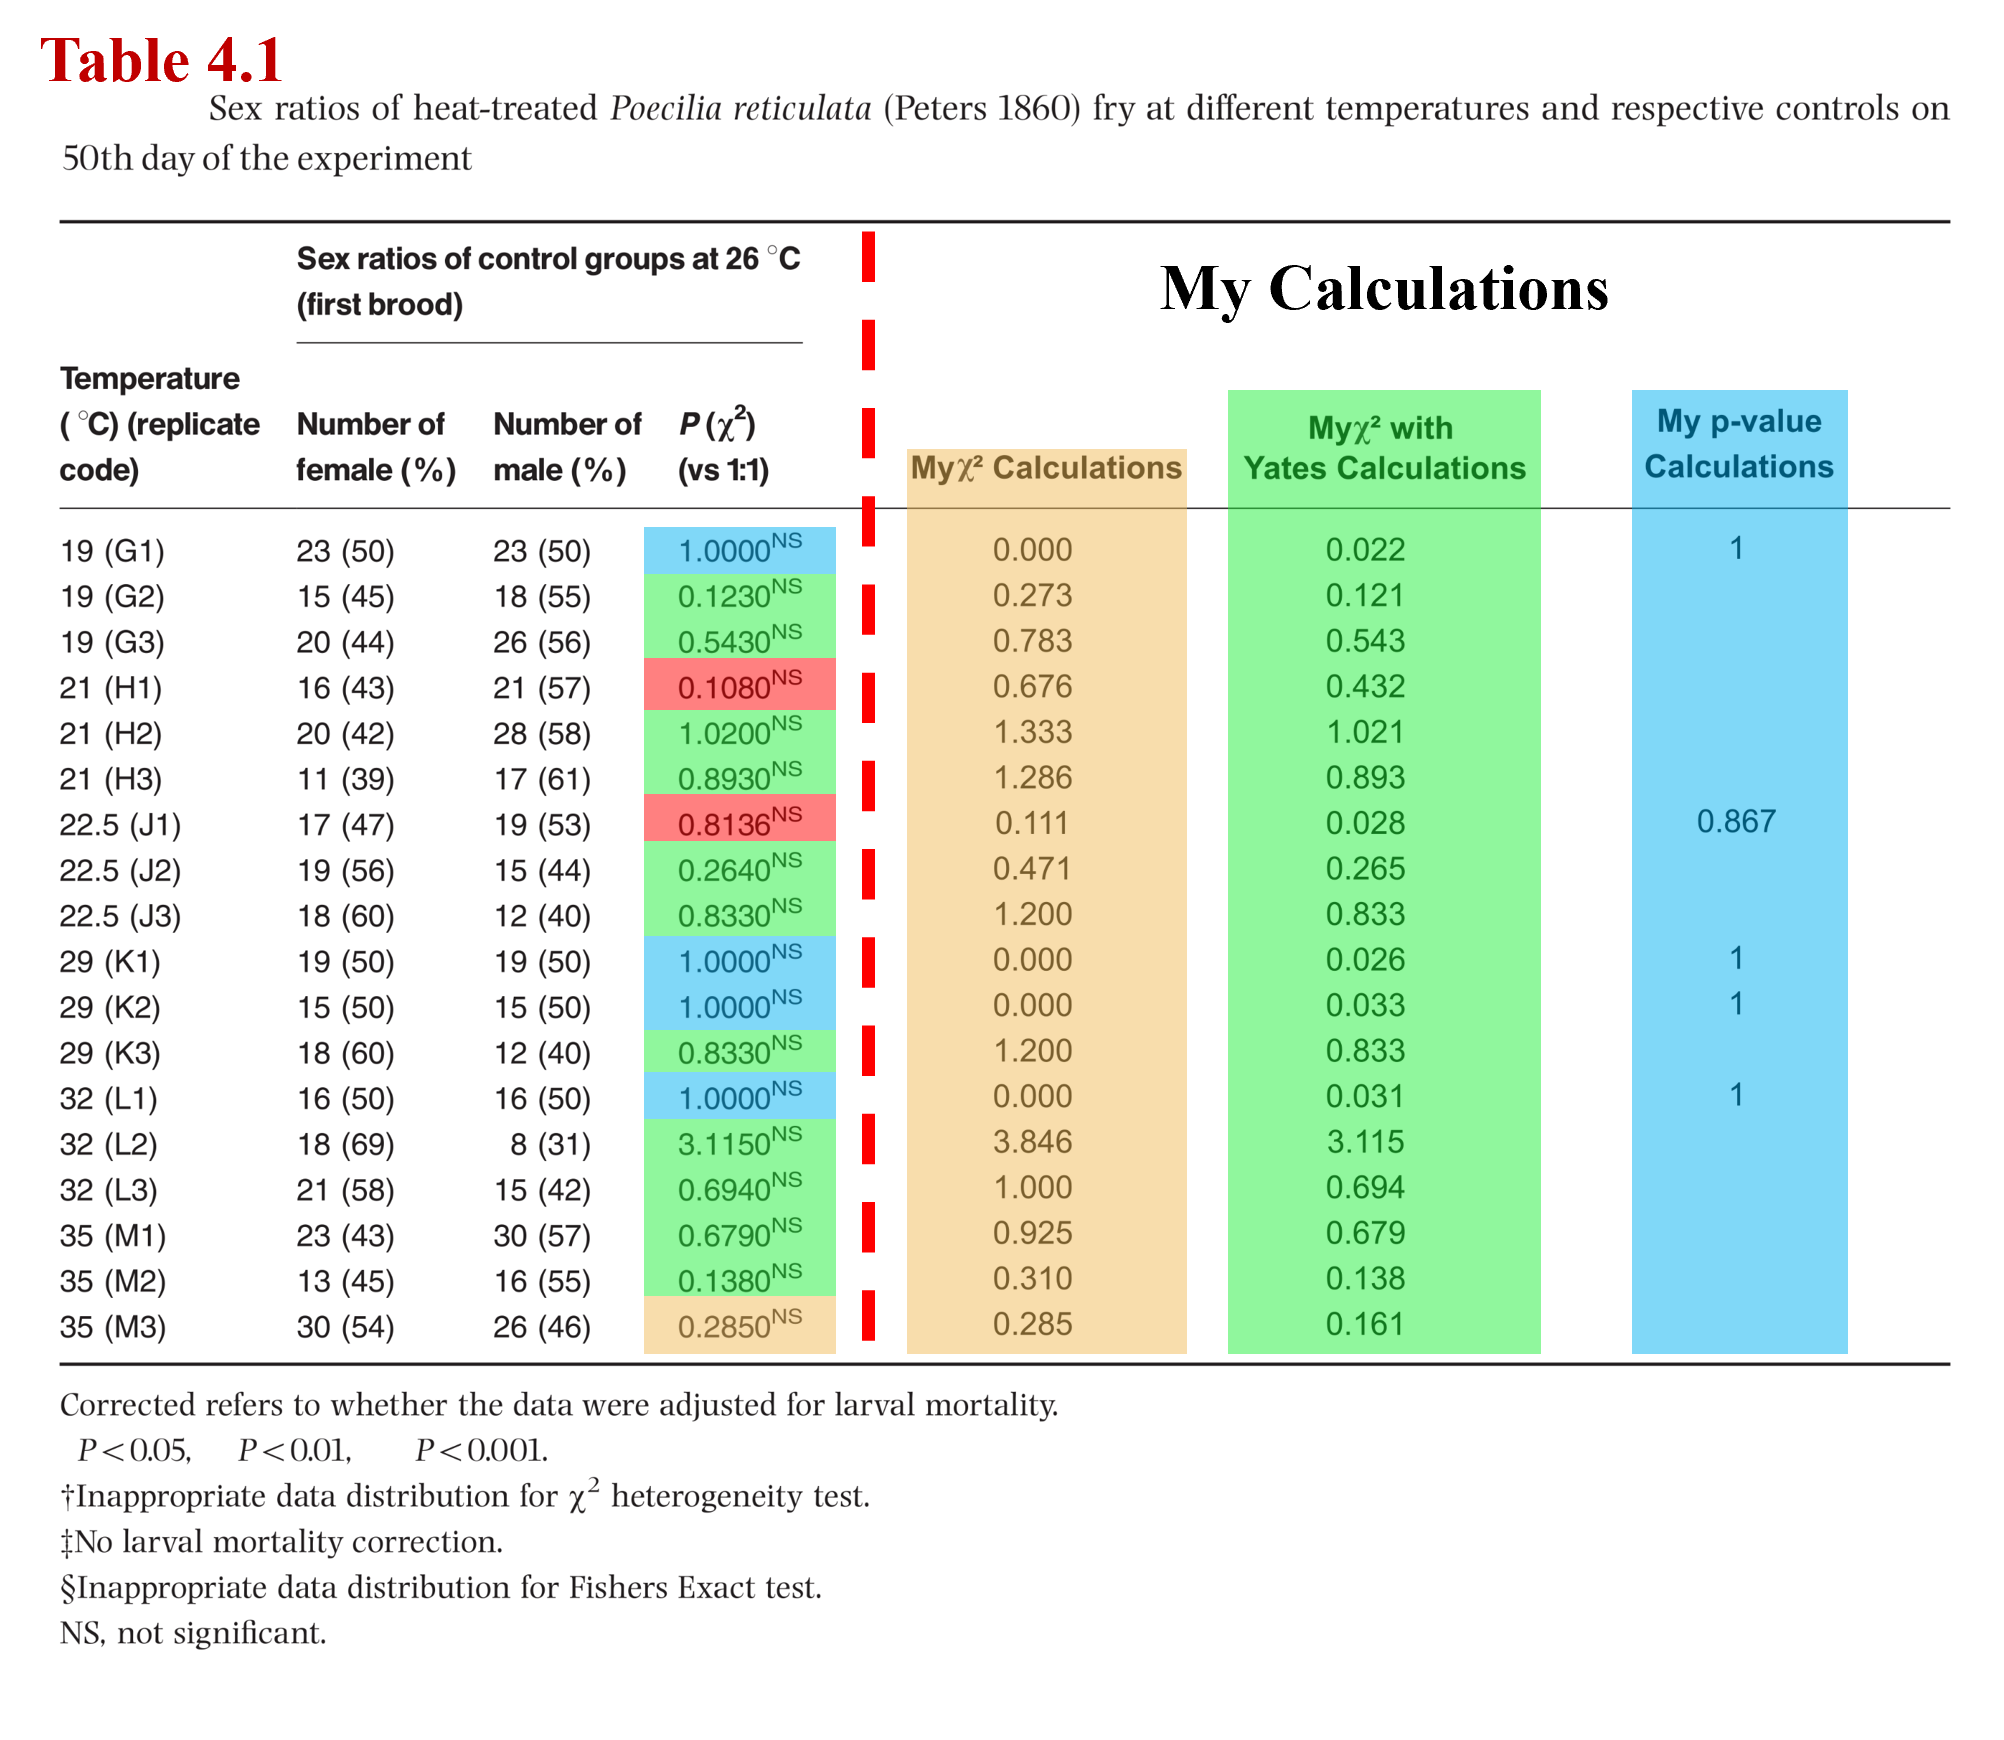
To pinpoint exactly where the math went off script, I created a modified version of their dataset, which I labeled Table 4.1. In this version, I removed all the original columns following P(χ²) (vs 1:1) and added my own calculation columns, running a standard Chi-squared test and a Yates-corrected Chi-squared test across the entire dataset, regardless of brood size.
By comparing my calculated columns against the authors' published data, I could instantly see where the values aligned and where they deviated. To make these patterns visual, I color-coded the cells to reveal the exact mathematical process the authors used—regardless of what their stated "rulebook" claimed:
- Orange: The authors used a standard, uncorrected Chi-squared calculation.
- Green: The authors correctly applied the Yates-corrected Chi-squared calculation.
- Blue: The authors accidentally published a P-value in place of a Chi-squared statistic.
- Red: The cell contains a mathematical mistake or is completely unreproducible.
Anomaly 1: The P-Value / Chi-Square Swap (The Blue Cells)
When inputting the raw data for the baseline control groups, my replication spreadsheet immediately clashed with four specific cells. The paper listed flat values of "1" for the Chi-squared statistics of groups G1, K1, K2, and L1.
In a Chi-squared analysis, a test statistic cannot seamlessly land on a flat 1 across entirely different brood sizes and sex distributions. But these groups did have a 50-50 distribution of males and females. So looking at the columns, it became clear that the authors accidentally swapped data fields when formatting the final manuscript table. They printed the P-values in the Chi-squared column instead. In statistics, a P-value of 1 means there is a flawless 50/50 match between observed and expected outcomes. Once these were translated back into their proper mathematical context, the blue cells resolved perfectly.
Anomaly 2: The Group J1 Oversight (The Red Cell #1)
The most significant mathematical mismatch occurred in Group J1 (the 17 Females / 19 Males split, where E = 18 for either males or females). The paper published a P-value of 0.8136 for this row. However, because this brood size falls under medium-sized guidelines, a proper Yates-Corrected Chi-squared test must be applied. The formula is structured as:
χ² = [ (|O_female - E| - 0.5)² / E ] + [ (|O_male - E| - 0.5)² / E ]
Plugging in the actual observed numbers from the paper:
- χ² = [ (|17 - 18| - 0.5)² / 18 ] + [ (|19 - 18| - 0.5)² / 18 ]
- χ² = [ (0.5)² / 18 ] + [ (0.5)² / 18 ]
- χ² = 0.0139 + 0.0139 = 0.0278
Converting a corrected χ² value of 0.0278 to a P-value yields 0.8676—the exact number calculated by my green Yates-corrected column.
So, where did the authors get 0.8136? By reverse-engineering potential entry errors, here is where the mistake probably lies. The authors made a double error in this cell: they skipped the Yates correction entirely, and they forgot to sum the male category into the final equation. Their spreadsheet code isolated only the female variance in a standard Chi-squared format:
χ²_omitted = (O_female - E)² / E
χ²_omitted = (17 - 18)² / 18 = 1 / 18 = 0.0556
Calculating a standard P-value for an uncorrected, half-finished χ² value of 0.0556 outputs exactly 0.8136. This confirms a potential copy-paste or formula omission error in their cell routing.
Anomaly 3: The Group H1 Outlier (The Red Cell #2)
The final mathematical discrepancy was found in Group H1. Despite running multiple permutations of uncorrected, Yates-corrected, truncated, and round-off error models, the published statistical value for this specific group could not be mathematically generated from the raw fish counts provided. This remains a likely transcription or copy-paste error from their native statistical software to the final text draft.
Takeaway
While this reveals that Table 4 is a bit messy (mixing up data columns, skipping its own rules on certain rows, and harboring formula omissions) the macro-level trends of the paper remain completely intact. The minor software routing errors do not invalidate the broader biological insights regarding thermal limits and sex-dependent mortality thresholds.